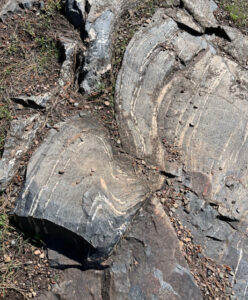
Hello all, I am Madison Shubert, and I am interning at Fort Lewis College in Durango for Planetary Geology. On Monday, July 18th I went on a field trip to a trail that wraps around Fort Lewis Campus, Carbon hills trail, and Haviland lake to go and observe different rock formations and geological formations around Durango. This included the La Plata mountains and other various hills, trenches, and trails caused by glaciation. On this field trip we looked at rocks that were between the ages of 65 million years ago and 1.4 billion years ago. The oldest rock there was a large piece of amphibole hornblende. Most of the rocks were made up of sandstone. But there were a few representations of igneous and metamorphic rock. We encountered a large section of coal at the Carbon hills trail. By the way, coal has methane trapped in it so it smells pretty bad there. And for the second half of the day I calculated and measured data about a picture of “Sarid01” , an area on Europa. In hopes of finding out it’s Elongation.
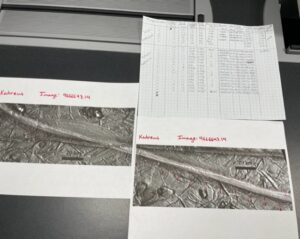
On Tuesday, July 19th I collected data from a photo of “Katreus” on Europa. Where I measured the band and shadows of Katreus. Then I would scale my measurements into kilometers. Next I would calculate its elevation, crustal root, total crustal thickness, initial width, in order to find its elongation.
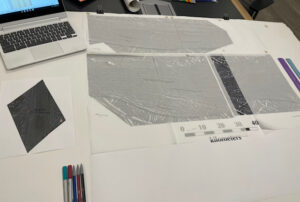
On Wednesday, July 20th I spent the morning measuring 128 points on a photograph of another place on Europa called “Agenor” . I measured the shadow and the band of each point and entered them into a spreadsheet. That way I don’t have to do all of the math by hand. For the second part of the day I worked with my spreadsheet in order to make graphs of the three places on Europa that we collected data on: Sarid01, Katreus, and Agenor. I spent the end of the day discussing with my mentor what our final research question would be. And the correct way of writing one.
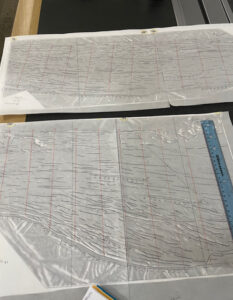
On Thursday, July 21st It was mainly a data collection day. I worked on mapping lineations in Agenor. Which means that I traced all of the ridges in the band of Agenor with a light table. And then we separated Agenor into 20 different profiles. Where I then counted all of the ridges that intersect the profile line. Next I entered all of our newly found data into our spreadsheet. Where it calculated all of the potential shortening that Agenor has undergone. Which is how much of the surface of Agenor has disappeared through convergent tectonic activity. At least it is like this on Earth. Next I used our data to make two scatter plot graphs.
On Friday, July 22nd I spent the majority of the day measuring and calculating shortening at four different cross sections on Earth. I did this so that next week I can measure parts of Agenor to help us try and unravel it’s strange appearance. This will also go with our data from the rest of the week. So we have more proof that our theory’s have promising evidence. It has been very exciting trying to discover brand new ideas in the world of geology. This has been a truly inspiring 2 week.


There are no comments published yet.