Welcome to week 2 and sorry for the delay as there were some technical difficulties that have now been solved! This week in the lab I was able to finalize my hypothesis and actually start analyzing some of the data that had been collected from Enrico’s research with paralysis therapy. Something to keep in mind is that many of these individuals have been paralyzed for years and are still attending physical therapy which would suggest that they may still have hope or are just trying to prevent further muscular dystrophy. In our research we don’t look at patients progress over time although that something I’m very interested in. Instead as explained last week we measure their ability AT ALL to move or react. With my study I’m measuring the different between patients who use a bar for support versus ones who don’t. In a normal individual it would make perfect sense that the bar would allow for pressure to be taken off the legs so naturally your leg muscles would need to work harder without support. This is still true with paralysis but what I at first didn’t realize was that the lack data I saw with the non-support trials wasn’t because I was wrong but rather because they would simply fall over or need assistance. Now obviously their legs aren’t supposed to work so maybe that fact should have been naturally occurring in my brain but my head was wrapped around the idea that their reflexes would engage and while that was the idea and did happen in many it didn’t for some. See without the brains connection to the spinal cord due to the injury the patient can not consciously control their legs, YET, but the body is able to create involuntary responses which is the point of physical therapy but in using support the response isn’t as radical and the recovery process may take longer. In order for this practice to take affect first we must know if it’s effective!
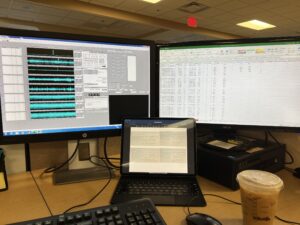
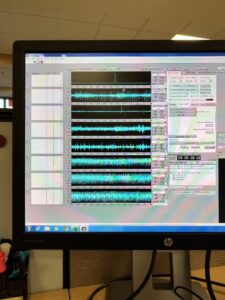
This is my cubical where I do all my work and drink my coffee because Sacha runs on Starbucks ! The monitor with the blue lines shows rather waves lengths for the activation levels in different muscle groups. The closer, more frequent and more random the better. Since the patients muscle activation is tracked using electrode sensors usually their activation is very sudden and moves in clear cut pulses with a little movement between in our muscles the activation is far more random and frequent.
In the bottom box is what would most likely end up being categorized as a five or six meaning that most if not all movement can be attributed to the individual not the electrode. However in order for the data to be captured you have to zoom in a bit.
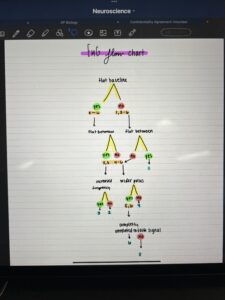
Here I’ve created a flow chat if you will that I use to categorize each datapoint. While are six “levels” they aren’t really levels at all, their more categories and while some 4, 5, 6, are just increasing levels of activation as seen on the chart you could find your self trying to differentiate a one from a four and be completely sure that it wasn’t a two or three. Fortunately for me so far the trials with no support have had more activation but we’ll see of this continues as I analyze more trials.
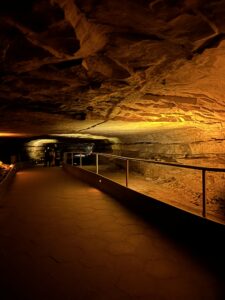
Outside I did some fun things too, maybe not as cool as furthering paralysis research but what can really compare! Anyways my host family took me to see mammoth cave one of the largest cave systems in the world and to b honest the entire time I was inside the one thing I wanted to do so badly that I couldn’t do was climb it’s walls. Especially since the part we saw was made of sandstone which can be prime climbing material.
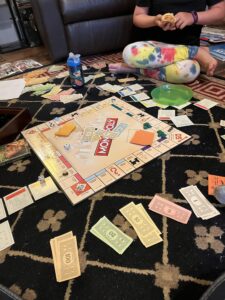
I was also owned by a nine year old genius in both monopoly knowledge of physics
This week was quite the experience, I cant wait to see what the next one will hold!


There are no comments published yet.