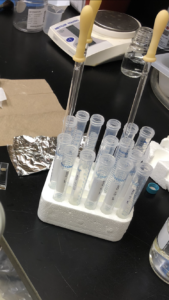
This week was great! I started the week off with some data analysis where I made graphs on excel using the data I collected from the experiment last week. Then, I continued to work in the lab where I made more samples using my KPI buffer and different amounts of a NATA stock and L-Tryptophan stock to make different concentrations. I then again used the fluorometer and the spectrophotometer. The fluorometer shows the fluorescence of a sample in cps (counts per second), while the spectrophotometer shows the absorbance of a sample at different wavelengths and can be used to the true concentration of a sample. Some times the true concentration can be quite different from the expected concentration. I finished up my week with some more data analysis.
Outside of my internship, my host family took my to ocean beach, where I saw a beautiful sunset accompanied by the green flash. In addition, I was able to explore the old town of San Diego. I ate some delicious Mexican food and browsed the local shops. To finish up the week I got to explore down town San Diego and see some very cool statues!


There are no comments published yet.