The second week of my internship was just as exciting as my first. This week we primarily focused on analyses that we have to run in Molecular Dynamics (MD) simulations. Molecular Dynamics simulations are used to see how structures change over time compared to the starting point.
The week started off by learning about the analyses RMSD and RMSF. The analysis RMSD, short for Root Mean Square Deviation, is the average displacement of the atoms. In other words, it shows how the values change through a simulation. The analysis RMSF, Root Mean Square Fluctuation, is the calculation of an individual residue flexibility. It basically shows how much a particular residue moves during a simulation. The values for both RMSD and RMSF are calculated by the computer, using complicated equations. The values for the RMSF are plotted and you can indicate which amino acid in the protein contributes the most to a molecular motion.
On Thursday, one of my mentors introduced us to distance analysis. Distance analysis allows us to measure the interatomic distance between two atoms. For this analysis we used VMD (Visual Molecular Dynamics), which is a molecular modeling and visualization computer program. We first went through a tutorial that teaches us how to set up our computers to be able to run through the simulations. In order to get it going, we first have to load the trajectory files into VMD. The trajectory files are large binary files that contain the time varying atomic coordinates for the system. We were given the task to do the distance analysis on all the 6 HSP90 (Heat Shock Protein 90) systems. The task was to identify any hydrogen bonds, hydrophobic interactions, and pi stacking between the protein and the ligand. Hydrophobic interactions are contacts between a carbon and a carbon. Pi stacking are noncovalent interactions between aromatic rings. Once these were identified, we were to find the distance between the two atoms. We had to record the distances and the atom name. This was only the beginning of the distance analysis. The next step, was to plot the results and took a lot of coding. Unfortunately, I was only able to finish two systems because each system has three trajectory files and you have to look at each one for all of the 6 systems in HSP90.
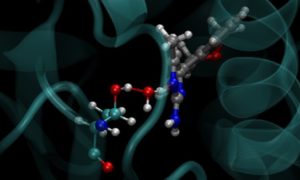
While I was doing the data analysis on NEQSA (one of the 6 systems in HSP90) I found something interesting. I found a water molecule that formed a hydrogen bond with the ligand in NEQSA and with the protein through the entire trajectory. This could mean that the water molecule could have effects on the ligand and active site.
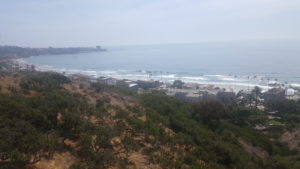
On Friday, some of the mentors from the BioChemCore program took all the members to the Birch Aquarium. The aquarium is at the Scripps Institution of Oceanography. I was able to see some impressive aquatic animals. The aquarium is close to La Jolla Shores that you get amazing views from the aquarium as well.
Outside the lab, I spent most of my time at the beach. We had 4th of July off and I was able to see the fireworks from the La Jolla Shores. Although, the fireworks weren’t at the beach, you could see them from there while relaxing at the shore. There wasn’t many people there, which I was surprised but pleased that it wasn’t crowded.
I am starting to notice how quickly the weeks are passing by, so I am trying as many new things as I can.


There are no comments published yet.